Texas Fatal Accident Study:

Texas’ Deadliest Roads and Fatal Accident Statistics

Updated: August 3, 2026

Advertising & Editorial Disclosure

Texas Deadly Road Maps

Based on an analysis of 10,125 fatal crashes from 2018 to 2020, MoneyGeek identified Texas' deadliest roads across 4,563 roads in the state's 683,533-mile road network.

The analysis also covered how drunk driving, speeding, distracted driving and time of year contributed to fatal crashes, and identified the deadliest road in each county.

Key Findings

  • I-10 from Exit 855A to Exit 849 is the deadliest stretch of road in Texas. Between 2018 and 2020, 17 fatal accidents occurred here.
  • Speeding contributed to 31.3% of fatal crashes (3,168 accidents) between 2018 and 2020, more than any other contributing factor.
  • Drunk driving accounted for 24.3% of fatal accidents (2,456 crashes), second only to speeding. Distracted driving ranked third at 9.9% (1,001 fatal crashes).
  • October had the most fatal accidents (941) between 2018 and 2020. November (912) and December (909) ranked second and third.
  • Harris County recorded the most deadly crashes. I-45 logged the most fatal accidents in the county (45).

10 Deadliest Road Stretches in Texas


  • 1. I-10 from Exit 855A to Exit 849
    Cities:Beaumont
    I-10 from Exit 855A to Exit 849Beaumont

    • 17Fatal Accidents
    • 17fatalities
    • 4Crashes Per Mile
    • 4.0 milesdistance
    • (30.09467222, -94.092225)start
    • (30.05436944, -94.14076111)end
    • [ 5 6 66 82 129 138 164 179 198 213 214 244 252 258 261 265 267]points
    • 72ordering
    • {'Not Applicable', 'Beaumont'}localities
    • {'Jefferson'}counties
    • TRUEintersect
    • I-10TWAY_ID

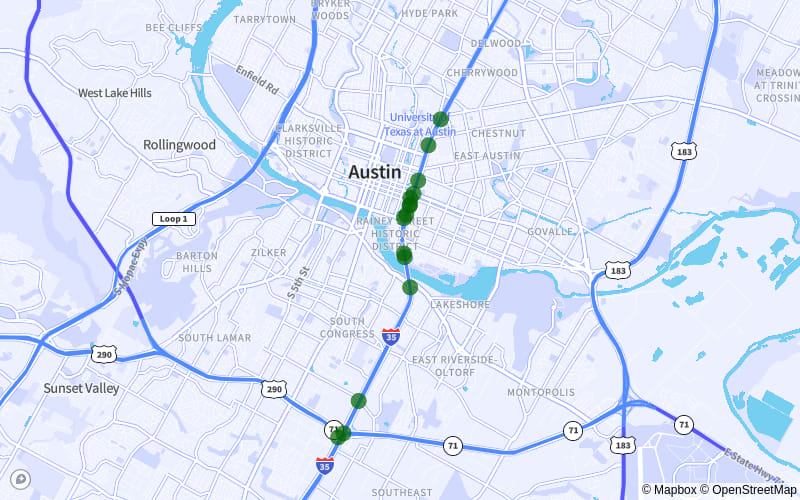
  • 2. I-35 from Exit 238B to Exit 244
    Cities:Austin
    I-35 from Exit 238B to Exit 244Austin

    • 16Fatal Accidents
    • 18fatalities
    • 3Crashes Per Mile
    • 4.9 milesdistance
    • (30.3162, -97.70764444)start
    • (30.38095278, -97.67415278)end
    • [ 0 22 42 63 66 79 84 86 116 122 139 147 166 201 215 221]points
    • 52ordering
    • {'Austin'}localities
    • {'Travis'}counties
    • TRUEintersect
    • I-35TWAY_ID

  • 3. I-35 from Exit 235B to Exit 229
    Cities:Austin
    I-35 from Exit 235B to Exit 229Austin

    • 15Fatal Accidents
    • 15fatalities
    • 3Crashes Per Mile
    • 4.8 milesdistance
    • (30.28226111, -97.72775)start
    • (30.21559722, -97.75260833)end
    • [ 15 40 41 56 65 82 88 114 129 130 133 145 146 150 172]points
    • 47ordering
    • {'Austin'}localities
    • {'Travis'}counties
    • TRUEintersect
    • I-35TWAY_ID

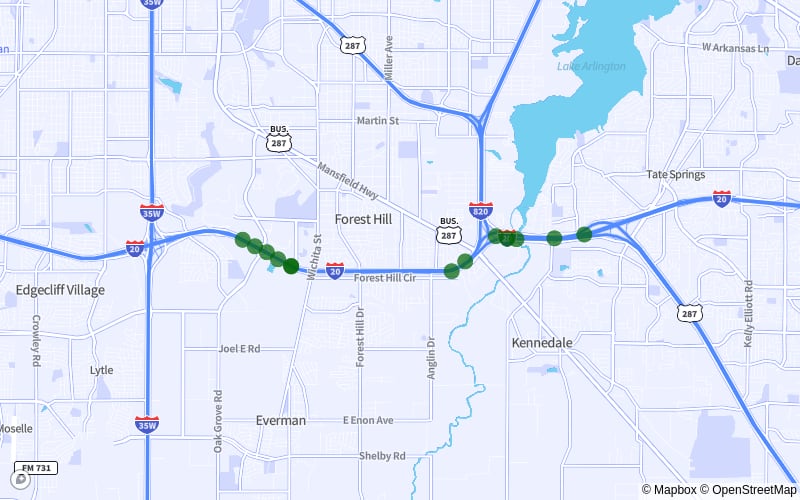
  • 4. I-20 from Exit 443 to Exit 439
    Cities:Forest Hill | Arlington | Fort Worth
    I-20 from Exit 443 to Exit 439Forest Hill | Arlington | Fort Worth

    • 13Fatal Accidents
    • 14fatalities
    • 3Crashes Per Mile
    • 4.8 milesdistance
    • (32.66902222, -97.21553889)start
    • (32.66795833, -97.29847222)end
    • [ 42 55 62 94 109 111 132 156 162 189 200 206 221]points
    • 35ordering
    • {'Forest Hill', 'Arlington', 'Fort Worth'}localities
    • {'Tarrant'}counties
    • TRUEintersect
    • I-20TWAY_ID

  • 5. Fm 1093/Westheimer Road from Westerland Drive to W Loop S
    Cities:Houston
    Fm 1093/Westheimer Road from Westerland Drive to W Loop SHouston

    • 13Fatal Accidents
    • 13fatalities
    • 3Crashes Per Mile
    • 4.4 milesdistance
    • (29.73720556, -95.53047222)start
    • (29.74099444, -95.45775278)end
    • [ 0 1 3 6 8 9 10 11 12 13 14 15 16]points
    • 39ordering
    • {'Houston'}localities
    • {'Harris'}counties
    • TRUEintersect
    • Fm 1093/Westheimer RdTWAY_ID

  • 6. I-30 from Exit 52A to 56C
    Cities:Dallas | Mesquite
    I-30 from Exit 52A to 56CDallas | Mesquite

    • 12Fatal Accidents
    • 12fatalities
    • 2Crashes Per Mile
    • 4.9 milesdistance
    • (32.79409722, -96.70044167)start
    • (32.82623611, -96.62461667)end
    • [12 26 30 40 43 47 48 56 74 76 77 88]points
    • 29ordering
    • {'Dallas', 'Mesquite'}localities
    • {'Dallas'}counties
    • TRUEintersect
    • I-30TWAY_ID

  • 7. I-45 from Exit 63 to Exit 59
    Cities:Houston
    I-45 from Exit 63 to Exit 59Houston

    • 11Fatal Accidents
    • 12fatalities
    • 2Crashes Per Mile
    • 4.6 milesdistance
    • (29.96909444, -95.42036111)start
    • (29.90263056, -95.41211389)end
    • [ 7 32 34 60 62 67 70 90 104 113 139]points
    • 26ordering
    • {'Not Applicable', 'Houston'}localities
    • {'Harris'}counties
    • TRUEintersect
    • I-45TWAY_ID

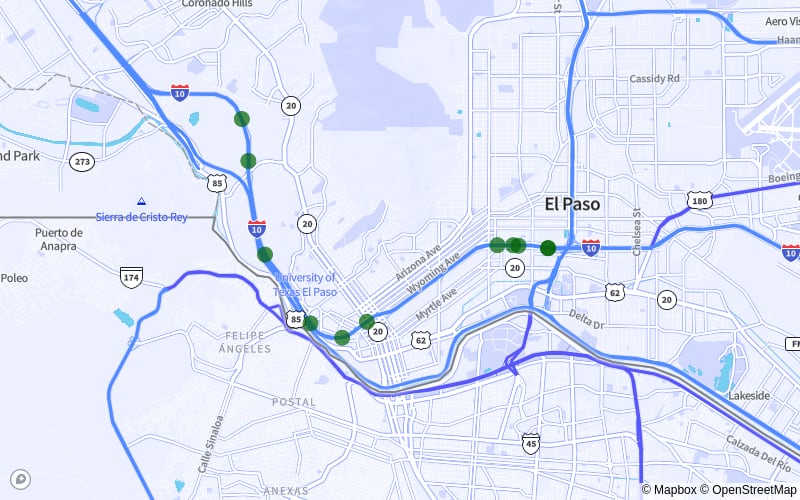
  • 8. I-10 from Exit 16 to Exit 21
    Cities:El Paso
    I-10 from Exit 16 to Exit 21El Paso

    • 11Fatal Accidents
    • 11fatalities
    • 2Crashes Per Mile
    • 4.7 milesdistance
    • (31.80419444, -106.5214583)start
    • (31.7775, -106.4471361)end
    • [ 53 107 123 128 133 134 145 156 161 168 178]points
    • 26ordering
    • {'El Paso'}localities
    • {'El Paso'}counties
    • TRUEintersect
    • I-10TWAY_ID

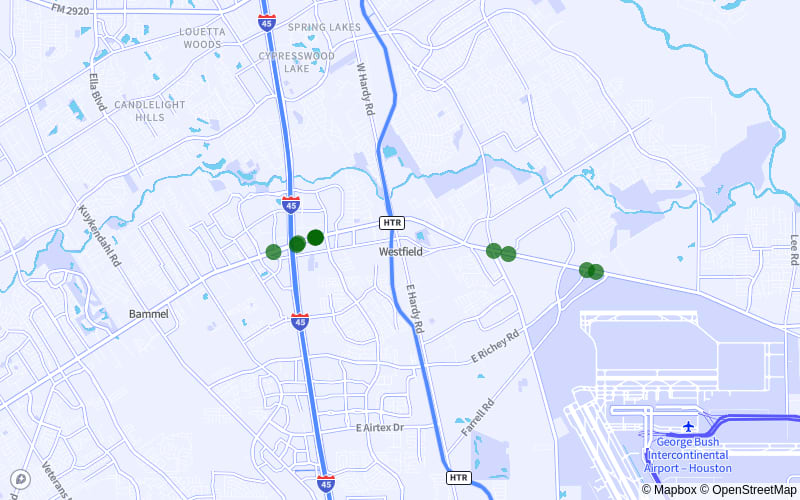
  • 9. Fm 1960 from Westfield PI Drive to Midway Plaza Drive
    Cities:Harris County
    Fm 1960 from Westfield PI Drive to Midway Plaza DriveHarris County

    • 10Fatal Accidents
    • 12fatalities
    • 2Crashes Per Mile
    • 4.7 milesdistance
    • (30.01995833, -95.43325833)start
    • (30.01579444, -95.35498333)end
    • [ 1 2 3 6 9 17 19 21 25 29]points
    • 21ordering
    • {'Not Applicable'}localities
    • {'Harris'}counties
    • TRUEintersect
    • Fm 1960TWAY_ID

  • 10. I-820 from Exit 33C to 30A
    Cities:Fort Worth
    I-820 from Exit 33C to 30AFort Worth

    • 10Fatal Accidents
    • 11fatalities
    • 3Crashes Per Mile
    • 4.0 milesdistance
    • (32.678225, -97.24045833)start
    • (32.73500278, -97.22501389)end
    • [ 2 5 6 10 11 12 13 18 21 26]points
    • 25ordering
    • {'Fort Worth'}localities
    • {'Tarrant'}counties
    • TRUEintersect
    • I-820TWAY_ID

Drunk Driving Involved in 24.3% of Fatal Accidents

Texas recorded 10,125 fatal accidents between 2018 and 2020; 2,456 involved a drunk driver.

Alcohol impairs judgment and reaction time even at low concentrations. Texas law sets the legal BAC limit at 0.08%, but impairment begins at 0.02%.

Even without a crash, a DUI arrest carries serious legal consequences. Penalties include license suspension and jail time. A conviction also affects insurance rates; SR-22 filing requirements lead to higher premiums.

Speeding Is the Top Factor in 31.3% of Fatal Crashes

Between 2018 and 2020, speeding contributed to 3,168 fatal accidents in Texas, 31.3% of all fatal crashes in the state.

Higher speeds mean longer stopping distances and less time to react. When a driver runs out of stopping distance, crashes become fatal.

Distracted Driving Contributed to 9.9% of Fatal Accidents

Distracted driving was linked to 9.9% of fatal accidents in Texas (1,001 of 10,125). Nationally, Texas ranks 13th worst for distracted driving.

October Had More Fatal Accidents Than Any Other Month

October saw 941 fatal accidents between 2018 and 2020, 9.3% of all fatal crashes in the state.

November ranked second with 912 fatal accidents, and December ranked third with 909. The three months combined for 27.3% of all fatal accidents during the study period.

Safe Driving Reduces Fatal Crash Risk

Speeding, drunk driving and distracted driving accounted for more than 65% of fatal crashes in Texas between 2018 and 2020.

Texas requires all drivers to carry minimum coverage. The average cost of auto insurance in Texas is $1,316 a year; rates vary by county and city. Houston drivers average $1,560 a year in coverage versus $1,096 in Lubbock. The gap between each market's cheapest rates is $464.

MoneyGeek's figures are averages for full coverage policies. Actual rates vary by age, location and driving record.

Fatal Accidents and Most Dangerous Roads: County Breakdown

The top five counties in Texas recorded 3,453 fatal accidents combined, 34% of all fatal accidents between 2018 and 2020.

Harris County had the most fatal accidents at 1,221. I-45 was the deadliest road in the county (45 fatal accidents). Drunk driving (353) and speeding (346) were the top contributing factors.

Methodology

MoneyGeek sourced data from the National Highway Traffic Safety Administration's Fatality Analysis Reporting System (FARS). The analysis covers records from 2018, 2019 and 2020.

About Doug Milnes, CFA


Doug Milnes

Doug Milnes is a CFA charterholder with over 10 years of experience in corporate finance. He led the Credit Cards vertical at MoneyGeek. At Duff and Phelps, he performed valuations. He later conducted financial planning and analysis at several other companies. His analysis has been cited by U.S. News & World Report, The Hill, the Los Angeles Times, the New York Times and many other outlets.

Doug holds a master's degree in data science from Northwestern University. He writes about credit card strategy, including debt management and rewards.


Sources